August 2023 Market Stats
In Metro Vancouver, as summer ends, we’re seeing a typical seasonal slowdown in the housing market due to higher borrowing costs. This has led to a decrease in price gains and a drop in sales.
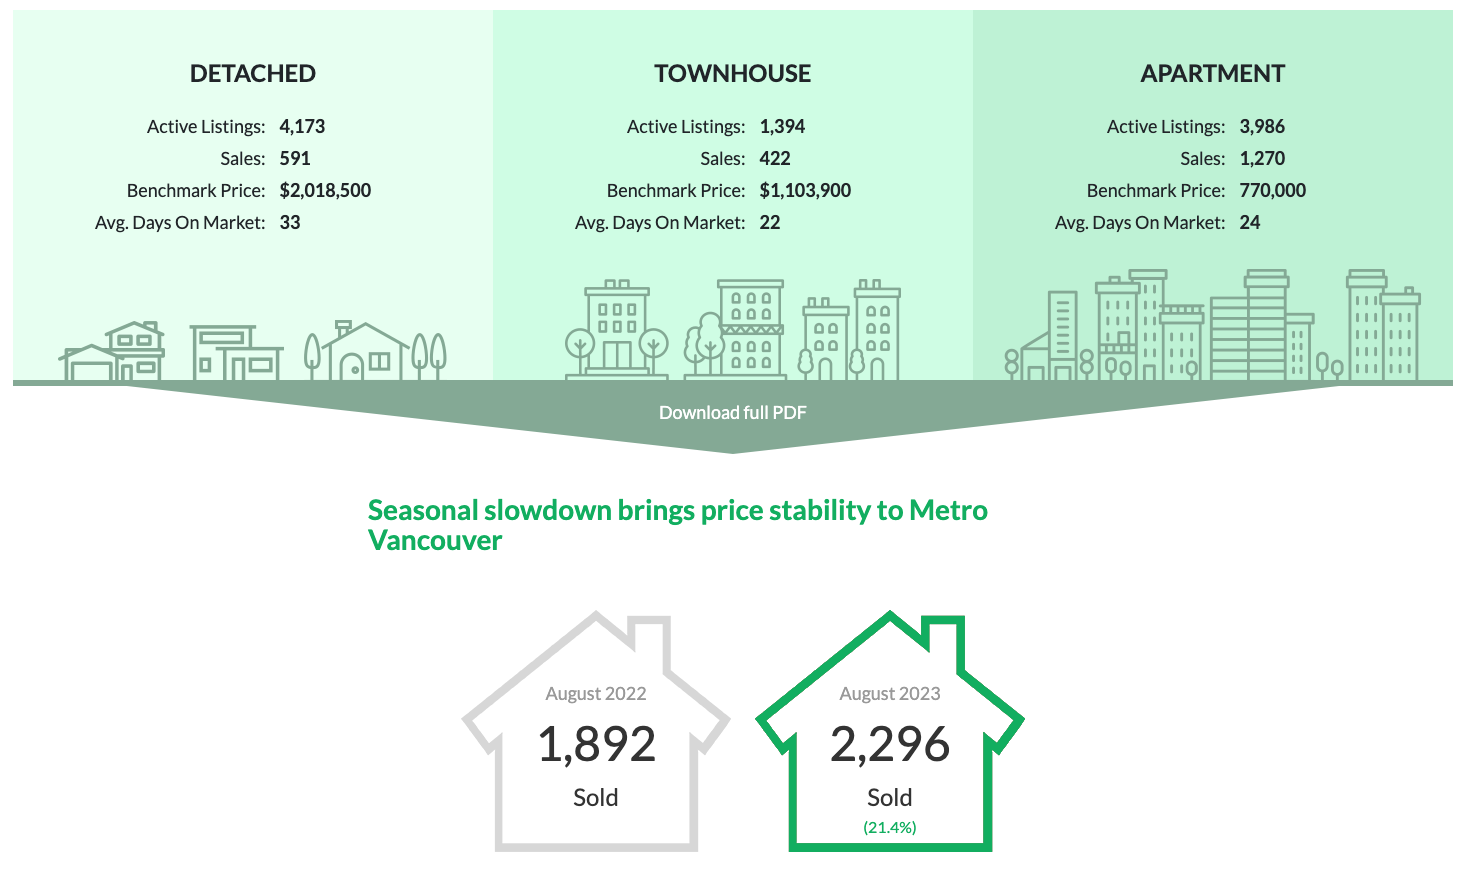
According to the Real Estate Board of Greater Vancouver (REBGV), there were 2,296 residential home sales in August 2023, which is a 21.4% increase from August 2022 but 13.8% below the 10-year average.
Andrew Lis, REBGV’s director of economics and data analytics, commented on the market’s performance this year, noting that despite high borrowing costs, the housing market in Metro Vancouver has remained relatively strong, with year-to-date price gains exceeding eight percent for all types of homes.
In August 2023, there were 3,943 new property listings, an 18.1% increase compared to August 2022, but slightly below the 10-year average. Currently, there are 10,082 homes listed for sale, a slight decrease from August 2022 and below the 10-year average.
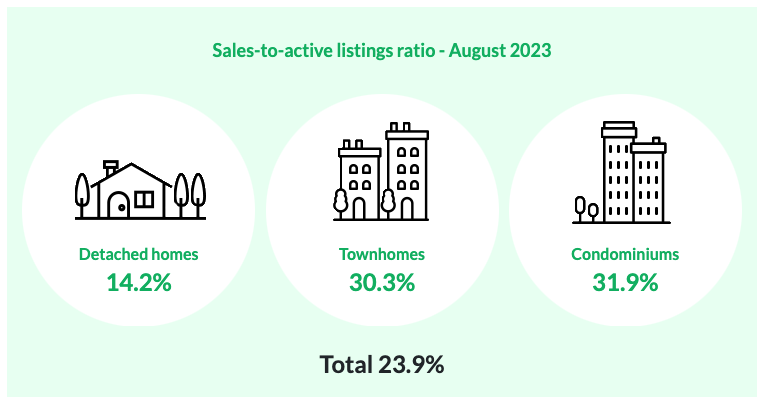
The sales-to-active listings ratio for August 2023 is 23.9%, and different property types have varying ratios. Historically, when this ratio falls below 12%, it puts downward pressure on home prices, and when it exceeds 20%, prices tend to rise.
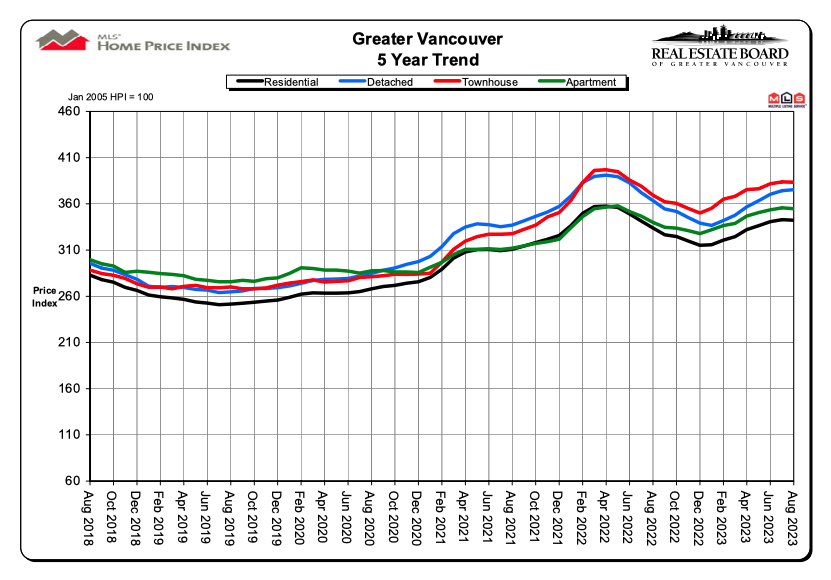
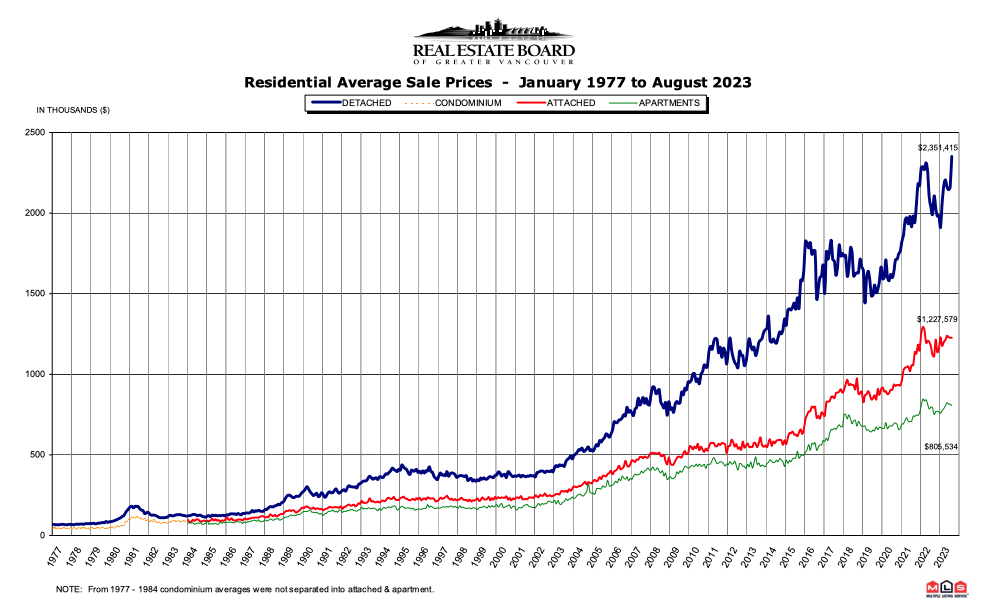
The MLS® Home Price Index shows that the benchmark price for all residential properties in Metro Vancouver is $1,208,400, a 2.5% increase from August 2022 and a slight decrease from July 2023.
Detached home sales in August 2023 reached 591, up 13.2% from August 2022, with a benchmark price of $2,018,500, representing a 3.3% increase from the previous year.
Apartment home sales in August 2023 were 1,270, a 27.4% increase from August 2022, with a benchmark price of $770,000, up 4.4% from the previous year.
Attached home sales in August 2023 totalled 422, an 18.9% increase from August 2022, with a benchmark price of $1,103,900, which is 3.9% higher than August 2022.


Want more detailed market information straight to your inbox every month?

SnapStats® is a complimentary monthly statistical report emailed to you FREE of charge that will educate you on the following:
- What are the odds of your home selling today? 1 in 10? 1 in 100?
- What is the speed of the market for your neighbourhood, style of home and price point?
- What is the official market type* for your price point, style of home and neighbourhood? A buyers, sellers or balanced market?
- The past thirteen month trends for sale prices, active listings and number of sales.
SnapStats® will educate you about opportunities of current inventory levels, prices and official market types today so that you can capitalize on these markets tomorrow.
Once you sign up, you will receive your first SnapStats report within two business days from me.

